Tag: value

P&G growth before and after Gillette ad

Gillette: get woke, go broke? How Gillette’s “woke” advertisement stifled their parent company’s growth

Get woke, go broke? Some have argued that Gillette’s parent company benefited from the Gillette ad, citing the spike in stock value that took place over a week after the ad ran. Others argue that the ad harmed Gillette’s stock and was a net negative.

P&G growth before and after Gillette ad
P&G growth before and after the Gillette “The Best Men Can Be” ad. Yes, I know that I started a couple of the lines on the wrong data point, but the calculations and dates in the text are correct.

Here, we see the truth. Gillette’s parent company, P&G, was growing at a rate of $0.12 in value per day from May 31, 2018 to December 14, 2018. There was a big drop at Christmas (not unusual for a retail company’s value to drop after the busy holiday buying season ends) and there was a correction one month later. The Gillette ad ran near the end of the low period spanning the first three weeks in January.

Zoomed out, it may appear that the ad caused the spike in stock value, but zooming in shows that the entire week after the ad was put out represented a loss in value, NOT a gain. The facts speak for themselves: if the ad had any short-term effect at all, it was a negative effect.

The subsequent spike is also easily explained. Because the ad was controversial and the stock spent a week dropping, bullish investors could see that a correction was overdue from the December drop and took the opportunity to buy while the price was going down so they could ride the stock on its way back up. This kicked off the expected correction.

What is most interesting about the charts (and ignored by those who endorse fact-free “woke” political agendas) is the long-term growth rate. Before the drop and correction, they were gaining value at $0.12 per day, but after the Gillette ad ran (and the expected correction from the December drop was finished), this dropped to $0.10 per day, a loss of 1/6 (16.67%) of the entire company’s growth. P&G is a huge company and Gillette is only one of their many brands; 19 of their brands rake in over $1 billion annually, and Gillette is one of those brands.

1/19 of the company’s biggest brands killed 1/6 of the company’s growth with a single “woke” advertisement. Get woke, go broke, indeed.


This was written up because of a comment by “Old Blanco Rd Productions” on a Coffee Break video about “woke advertising” on YouTube. Notably, this commenter would repeatedly try to pull the conversation back to an advertisement by Nike featuring Colin Kaepernick, an ad which caused some controversy because Colin is the originator of the “take a knee during the national anthem” thing at football games. The same commenter didn’t want to talk about Gillette and P&G and was only interested in Nike and pushing the statement that “Nike added $6 billion in value after the Colin Kaepernick commercial!” Typical bullshit accusations of “sealioning” by a “Spencer Person” ensued, though sealioning is nothing more than a logically fallacious attempt to discredit people who demand that you support your arguments with facts. Quoting from that last link: “In other words, “sealioning” is a gag to be imposed upon people you disagree with if they argue with you for too long, too persistently, or in any fashion that you dislike.” To sum it up, these two people are keen to control the conversation so they don’t lose the argument. If you’ve read everything above, you can see why they’d rather accuse me of illegitimate tactics than to accept the cold, hard, high-low-close facts in the stock charts.

What that last paragraph leads up to is this: I watched both commercials. The Nike ad was only controversial because Colin was in it, but the ad itself is not actually a “woke” ad. It’s a typical Nike ad with a positive message that encourages you to get out there and be successful and stand up for yourself. It’s a well-done advertisement that does exactly what a major brand wants: to connect their brand with positive associations in the mind of the viewer. The Gillette ad, on the other hand, was a negative ad that stereotyped not only the entire male gender, but also visibly drew racial divides, with white males as mindless villainous rapists-in-waiting and black males as the only thing keeping them from raping everybody out here. Its “positive message” was nothing more than sprinkles on a racist, sexist, man-hating, race-baiting turd of a commercial that reinforces the premise that men are pieces of trash by default. The Nike ad worked out well for Nike because it was a good ad with a good message. The Gillette ad disproportionately hampered the growth of a company that has 18 other billion-dollar brands they derive value from because it was designed to press all of the controversial sociopolitical agenda buttons that it could.

AMD’s FX-9590 is still the top CPU value four years later

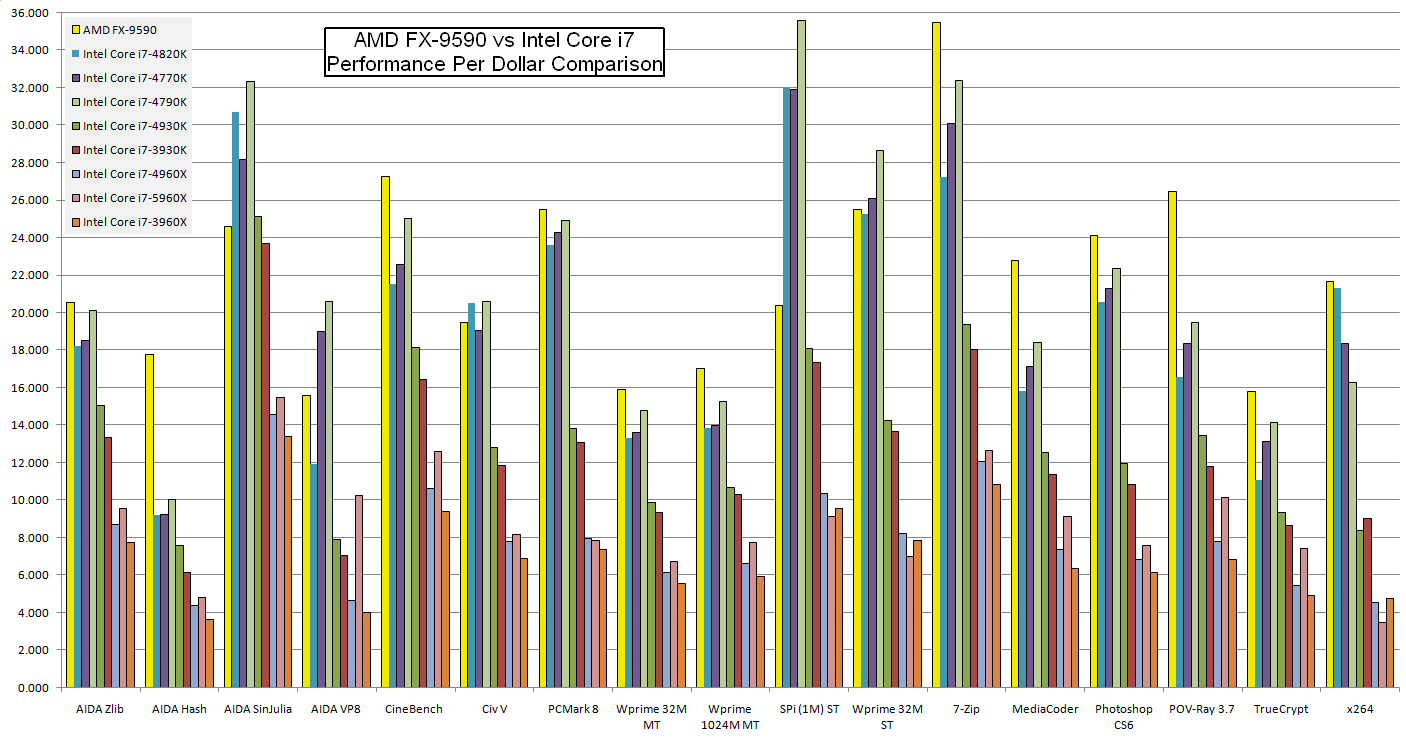
Back in 2014 when Jesus rode dinosaurs and Nazca aviators ruled the skies, I wrote an article about the AMD FX-9590 and how it beat all of the modern Intel chips of the day in a price-to-performance comparison I performed. It was a better value than every Intel Haswell and Broadwell chip available in 2014. Of course, benchmarks of newer systems against the aging FX-9590 show that gaming performance is clearly way better on newer platforms, largely due to PCI Express 3.0 support (FX-9590 boards max out at PCI Express 2.0 x16) and, more recently, the rise of consumer DDR4 memory and NVMe solid-state drives. As I was poking around various system benchmarks for newer platforms, I got curious about the FX-9590’s price-to-performance ratio today, four years and several processor generations later. You’d expect a chip that’s several generations long in the tooth to fall behind in value due to improvements in newer platforms, especially with AMD’s new Ryzen architecture fighting Intel’s 8th-generation i7 offerings.

Imagine my pleasant surprise when I saw this:

AMD FX-9590 best value on PassMark
AMD FX-9590 is still the best performance value on PassMark

Modern CPUs in the picture are boxed in orange. Notably, the price of an FX-9590 is way down from the $250-$300 range where it hovered for a long time. Amazon prices really are close to the stated $99.99 price tag. Four years after the power-sucking 220W 8-core beast was released, it continues to dominate in provided performance per dollar. I’m still using the FX-9590 system I built four years ago for heavy-duty computing work and video editing. I have other computers that are actually from the current year, but none of them is as fast as the FX-9590 box.

Long live the AMD FX-9590. You’re my favorite space heater and I hope you keep humming under my desk and making me uncomfortably hot for a long time to come.

Flamethrower FX-9590
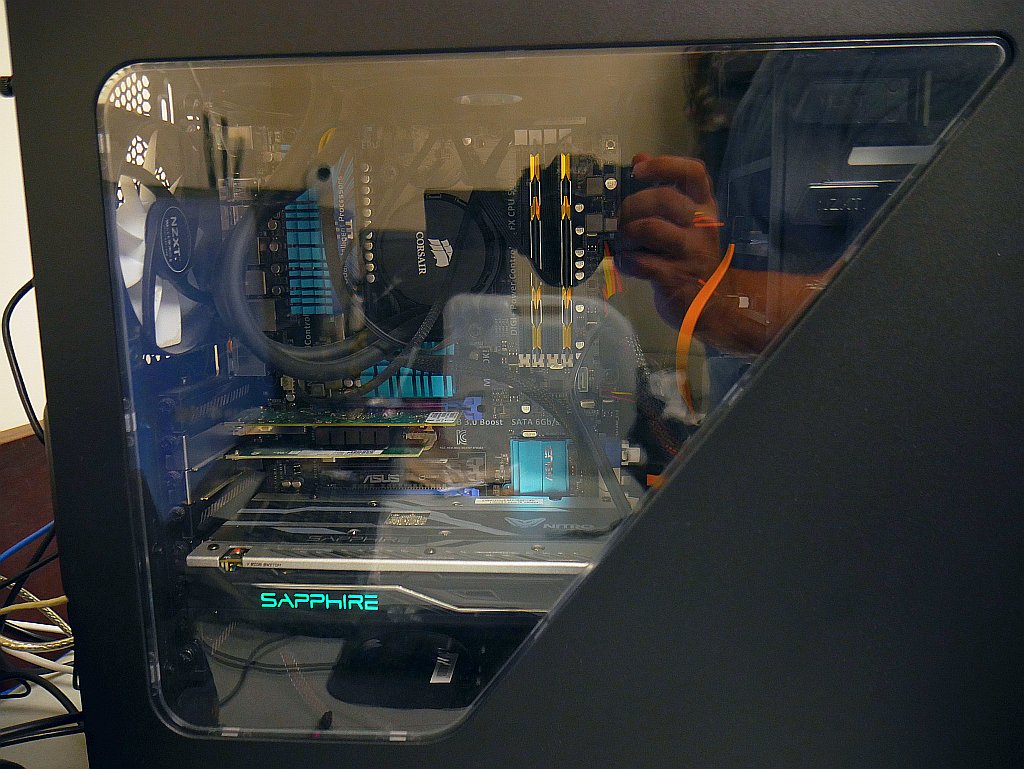
Affectionately known as “Flamethrower.”

AMD FX-9590 Beats Intel Core i7 (4770K, 4790K, 5960X, etc.) in Price vs. Performance Comparisons

I decided this month that it was time to look at replacing my AMD Phenom II X4 965 BE chip with something that could transcode high-definition video faster. Sure enough, I chose the AMD FX-9590 CPU. Arguments against the AMD FX-9590 on forums such as Tom’s Hardware and AnandTech include “power efficiency is too low/TDP is too high” and “Intel has higher/better instructions per clock (IPC)” and “Intel’s i7 performs so much better.” Notably, the price to obtain the superior Intel performance was almost completely ignored in these discussions. Consider that the AMD FX-9590 retails for around $260 and the Intel Core i7-4770K it is often compared to costs $335; that $75 difference is enough cash to buy a cheap motherboard or a 120GB SSD, and also represents a 29% price increase over the FX-9590. Does the i7-4770K really perform 29% better than the FX-9590? The short answer is “no.” The long exception to that otherwise straightforward answer is “unless you spend all of your time calculating Julia mandelbrot sets and the digits of pi.”

Over two years ago, I wrote an article about how AMD CPUs beat Intel CPUs hands down when you factor in the price you pay compared to the performance you get. Most of the arguments I received against my assertion were against the single-figure synthetic benchmark (PassMark) I used to establish a value for CPU performance. This is understandable; synthetic benchmarks that boil down to “One Number To Rule Them All” don’t help you decide if a CPU is good for your specific computer workload. This time, I’ve sought out a more in-depth benchmark data set which can be seen here. I compiled some the relevant figures (excluding most of the gaming benchmarks) into a spreadsheet along with the Newegg retail price of each CPU as of 2014-10-23, used a dash of math to convert “lower is better” scores into an arbitrary “higher is better” value and some fixed multipliers per benchmark to make them all fit into one huge graph which can be downloaded here: cpu_performance_comparison.xls

And now, ladies and gentlemen, the moment you’ve been waiting for: a graph of a wide variety of CPU benchmarks, scaled by the price you pay for each CPU (click to expand the image.)

amd_fx-9590_vs_intel_core_i7CPUs in each bar series are ordered by retail price in ascending order. The FX-9590 is in yellow on the left of each series and Intel only has a CPU that beats the AMD offering in 4 out of 17 price-scaled benchmarks, most of which are synthetic and don’t represent any typical real-world workloads.

AMD wins again.

Update: In case you needed more proof that the FX-9590 is the best encoding chip, someone sent me a few links to more x264 benchmarks: 1 2 3