Tag: performance

Slow computer or slow internet? Also, comedy: “STOPTIONAL”

I recently visited a business that I’ve helped with computer problems for nearly 10 years. They claimed to need faster computers because their accountants were trying to send QuickBooks data files to themselves through remote desktop tools and the speed was pretty terrible. When I got there and talked to them for a bit, I realized they were probably on a 10-year-old DSL internet package, so I ran a speed test.

1.5 Mbps down, 0.5 Mbps (512 Kbps) up. That’s nowhere near fast enough to upload QuickBooks data files fast enough! I told them to call CenturyLink and see about upgrading their package, possibly saving them thousands of dollars in computer upgrades and replacements.

Also at the start of this video is a fake Monster energy drink “sponsorship” skit. Don’t worry about the loud crash; the Monster can survived intact. 😉
The key to faster shell scripts: know your shell’s features and use them!

I have a cleanup program that I’ve written as a Bash shell script. Over the years, it has morphed from a thing that just deleted a few fixed directories if they existed at all (mostly temporary file directories found on Windows) to a very flexible cleanup tool that can take a set of rules and rewrite and modify them to apply to multiple versions of Windows, along with safeguards that check the rules and auto-rewritten rules to prevent the equivalent of an “rm -rf /*” from happening. It’s incredibly useful for me; when I back up a customer’s PC data, I run the cleaner script first to delete many gigabytes of unnecessary junk and speed up the backup and restore process significantly.

Unfortunately, having the internal rewrite and safety check rules has the side effect of massively slowing the process. I’ve been tolerating the slowness for a long time, but as the rule set increased in size over the past few years the script has taken longer and longer to complete, so I finally decided to find out what was really going on and fix this speed problem.

Profiling shell scripts isn’t quite as easy as profiling C programs; with C, you can just use a tool like Valgrind to find out where all the effort is going, but shell scripts depend on the speed of the shell, the kernel, and the plethora of programs executed by the script, so it’s harder to follow what goes on and find the time sinks. However, I observed that a lot of time was spent in the steps between deleting items; since each rewrite and safety check is done on-the-fly as deletion rules are presented for processing, those were likely candidates. The first thing I wanted to know was how many times the script called an external program to do work; you can easily kill a shell script’s performance with unnecessary external program executions. To gather this info, I used the strace tool:

strace -f -o strace.txt tt_cleaner

This produced a file called “strace.txt” which contains every single system call issued by both the cleaner script and any forked programs. I then looked for the execve() system call and gathered the counts of the programs executed, excluding “execve resumed” events which aren’t actual execve() calls:

grep execve strace.txt | sed ‘s/.*execve/execve/’ | cut -d\” -f2 | grep -v resumed | sort | uniq -c | sort -g

The resulting output consisted of numbers below 100 until the last two lines, and that’s when I realized where the bottleneck might be:

4157 /bin/sed
11227 /usr/bin/grep

That’s a LOT of calls to sed, but the number of calls to grep was almost three times bigger, so that’s where I started to search for ways to improve. As I’ve said, the rewrite code takes each rule for deletion and rewrites it for other possible interpretations; “Username\Application Data” on Windows XP was moved to “Username\AppData\Roaming” on Vista and up, while “All Users\Application Data” was moved to “C:\ProgramData” in the same, plus there is a potential mirror of every single rule in “Username\AppData\Local\VirtualStore”. The rewrite code handles the expansion of the deletion rules to cover every single one of these possible cases. The outer loop of the rewrite engine grabs each rewrite rule in order while the inner loop does the actual rewriting to the current rule AND and all prior rewrites to ensure no possibilities are missed (VirtualStore is largely to blame for this double-loop architecture). This means that anything done within the inner loop is executed a huge number of times, and the very first command in the inner loop looked like this:

if echo “${RWNAMES[$RWNCNT]}” | grep -qi “${REWRITE0[$RWCNT]}”

This checks to see if the rewrite rule applies to the cleaner rule before doing the rewriting work. It calls grep once for every single iteration of the inner loop. I replaced this line with the following:

if [[ “${RWNAMES[$RWNCNT]}” =~ .*${REWRITE0[$RWCNT]}.* ]]

I had to also tack a “shopt -s nocasematch” to the top of the shell script to make the comparison case-insensitive. The result was a 6x speed increase. Testing on an existing data backup which had already been cleaned (no “work” to do) showed a consistent time reduction from 131 seconds to 22 seconds! The grep count dropped massively, too:

97 /usr/bin/grep

Bash can do wildcard and regular expression matching of strings (the =~ comparison operator is a regex match), so anywhere your shell script uses the “echo-grep” combination in a loop stands to benefit greatly by exploiting these Bash features. Unfortunately, these are not POSIX shell features and using them will lead to non-portable scripts, but if you will never use the script on other shells and the performance boost is significant, why not use them?

The bigger lesson here is that you should take some time to learn about the features offered by your shell if you’re writing advanced shell scripts.

Update: After writing this article, I set forth to eliminate the thousands of calls to sed. I was able to change an “echo-sed” combination to a couple of Bash substring substitutions. Try it out:

FOO=${VARIABLE/string_to_replace/replacement}

It accepts $VARIABLES where the strings go, so it’s quite powerful. Best of all, the total runtime dropped to 10.8 seconds for a total speed boost of over 11x!

Is “dupd” really faster than my duplicate scanner “jdupes?”

UPDATE: I posted this and went to sleep. After I woke up, my inbox was full of issue report and pull request comments and closings. dupd now supports relative path arguments, has a larger I/O block size, and I patched a bug that caused total failure on XFS. That’s awesome!

Why am I picking on dupd?

I have written about my duplicate scanner “jdupes” in a previous post and have spent a lot of time enhancing it. I have run across two different blog posts online about duplicate file finders that compare jdupes with another scanner called “dupd” and proclaims dupd the clear speed winner for finding duplicate files. One post is by Eliseo Papa, comparing jdupes (when it was briefly called “fdupes-jody”) against dupd and showing that dupd was insanely faster, but used significantly more CPU and RAM. The other is by the dupd developer Jyri J. Virkki with a much newer version of jdupes than Eliseo used, finding that the scanned home directory with over 160,000 files was scanned by jdupes in approximately double the time as by dupd. Eliseo was using what today would be considered a very old and slow version of my program. Eliseo also tested a lot of scanners and didn’t provide any actual commands or methodology beyond a simple overview, though that’s completely understandable given how many programs were involved and that each one probably worked very differently. I’m more interested in Jyri’s results; Jyri provides actual command usage so I can attempt to replicate those results on my own systems. If dupd is double the speed of jdupes, I’d love to know how it’s being done, but first I must run some tests to verify that this is true.

Please note that I’m not really “picking on” dupd. It has been declared better than my own duplicate scanner by a third party and by the developer. There’s some pretty brilliant programming work in dupd and I have thoroughly enjoyed reading the code. This is intended to be a respectful rebuttal due to a combination of my own pride in my work and some obvious issues with Jyri’s testing. With that said, let’s discuss!

Methodology

Here’s a brief overview of the rest of this post.

  1. Use dupd and understand how to use it
  2. Explain the problem with Jyri’s tests
  3. Compile the latest version of both programs (GitHub master source)
  4. Detail of test system and test data
  5. Attempt to replicate Jyri’s results with a large data set on one of my machines
  6. Run my own benchmark tests to see which one is actually faster for me
  7. Final thoughts

Use and understand dupd

I ran into some immediate problems and quirks with how dupd works. Within about 15 minutes, I realized that dupd is a very different beast from jdupes. Where jdupes operates on the specified directories and saves no state anywhere between program runs, dupd will maintain an SQLite database in your home directory (by default) with the information it finds during its file scans. I tested dupd somewhere that had a directory with a backtick in the name and dupd skipped it; this is due to the use of a backtick as the SQLite separator character; dupd auto-ignores anything with a backtick to avoid potential problems with SQLite queries (–pathsep provides a workaround but this is still not quite ideal). dupd also doesn’t provide a way to ignore hard linked file pairs, so it’s up to the user to check the inode/device number pairs of dupd’s reported duplicate files with a command like stat if this is an important thing.

The most painful flaw I’ve found in dupd (and the one that gave me the most difficulty in working with it) is the file path specification restrictions. They’re absolutely maddening for my purposes because specifying paths is difficult. With jdupes I can arbitrarily work with multiple directories and use shell wildcard expansion to pick them out, but dupd only takes its file paths two ways: the implicit default of the current directory or one or more absolute paths (starting from /) which must each be prefixed with the -p or –path option. I can type something like “cd /home/user/food; jdupes -nr A* B*” but dupd requires that I type out e.g. “dupd scan –path /home/user/food/Apple –path /home/user/food/Avocado –path /home/user/food/Bacon –path /home/user/food/Broccoli” to selectively scan the same data set. For this reason, I restricted my testing to a single directory, passing nothing to dupd and passing a single dot to jdupes.

Why Jyri’s tests are flawed

There are some flaws that make Jyri’s “dupd vs. jdupes” tests unfair, mostly due to mismatched overhead:

  • dupd’s use of SQLite; to perform an apples-to-apples comparison, the –nodb switch is mandatory to disable this feature and dump the duplicate list to stdout just like jdupes.
  • Jyri’s test performed a duplicate scan with dupd which produced no output (no –nodb option and no run of “dupd report”) whereas jdupes produced full output
  • In addition to producing output, jdupes dumped that output to a file on disk
  • The jdupes progress indicator wasn’t disabled; progress indication blocks while printing to the terminal, slowing execution significantly for the sake of user-friendliness
  • Jyri’s tests were only run on cached data (high CPU, run times didn’t deviate) which tests algorithm speed but not performance when reading uncached data on a rotating disk

Compile the latest versions of each

For the record, I used dupd at commit 8f6ea02 and jdupes at commit 14d92bc in this test. If you want to attempt to replicate my results, you’ll need these exact revisions.

Test system and test data set

The system in use has an AMD A8-7600 quad-core CPU, 8GB of DDR3-1600 RAM, and 3x3TB 7200RPM SATA-6G hard drives. The drives are configured as a Linux md raid5 using the XFS filesystem (mounted with ‘noatime’). The deadline I/O scheduler is used for all physical devices. Maximum raw streaming read (measured with ‘pv’) on this array tops out at 374 MiB/sec near the beginning of the array and is about half as fast at the end. The array contains an “aged filesystem” which has some file fragmentation and probably has significantly less than ideal distribution of files relative to one another, making it an excellent choice for testing the program differences in a less artificial manner.

The test system is a dedicated, isolated system. It is not running anything other than the benchmarks. The CPU scaling governor is set to “performance” to lock the CPU at maximum speed and remove deviations caused by CPU frequency changes.

The first data set is a large collection of over 48,000 files that are stored in 135 subdirectories with no further subdirectories of their own. The average file size is 495 KB, while the smallest file is 925 bytes and the largest file is 3.3 MB. Total size is 23 GB. There are five hard-linked sets of files between them, but none are duplicates otherwise, so this is sort of a worst-case scenario because all actual duplicate scan comparison work is wasted effort.

The second data set is a smaller set of over 31,000 files in 12 subdirectories and 762 total directories (find -type d | wc -l). The average file size is 260 KB, the smallest file is 40 bytes while the largest file is 6.3 MB. Total size is 7.8 GB. There are no hard linked pairs and there are 208 duplicate files in 39 duplicate sets, occupying 23 MB.

Attempt to replicate Jyri’s tests

Jyri ran the following commands:

repeat 5 time ./jdupes -r $HOME -A  > out
repeat 5 time dupd scan -p $HOME -q

To normalize the results, I’ll read all the files so they’ll populate the disk cache as Jyri seems to have done. I will run the Bash equivalent of these commands on my data set as my first tests. I also ran

$ export TIMEFORMAT='%Us user %Ss system %P%% cpu %E total'

to get timing output similar to Jyri’s time measurement output. I have erased the jdupes progress output beyond the first run for aesthetic reasons.

Data set 1

$ X=0; while [ $X -lt 5 ]; do time jdupes -r . -A > out; X=$((X + 1)); done
Examining 48271 files, 135 dirs (in 1 specified)
0.043s user 0.060s system 96.47% cpu 0.107 total
0.027s user 0.080s system 97.53% cpu 0.109 total
0.043s user 0.060s system 95.55% cpu 0.108 total
0.040s user 0.067s system 97.02% cpu 0.110 total
0.037s user 0.067s system 95.76% cpu 0.108 total

$ X=0; while [ $X -lt 5 ]; do time dupd scan -q; X=$((X + 1)); done
0.110s user 0.087s system 36.43% cpu 0.540 total
0.120s user 0.077s system 67.83% cpu 0.290 total
0.117s user 0.077s system 67.13% cpu 0.288 total
0.110s user 0.083s system 67.80% cpu 0.285 total
0.120s user 0.077s system 53.00% cpu 0.371 total

Even with Jyri’s switch choices which are biased towards dupd, dupd is still 2.5 times slower (or worse) than jdupes here. Surprisingly, the wild time deviation seen above happened in nearly every run. The closest run to any consistency circled around 0.300 total time. This test implies that if there are almost no duplicates, dupd wastes significantly more time than jdupes.

Data set 2

$ X=0; while [ $X -lt 5 ]; do time jdupes -r . -A > out; X=$((X + 1)); done
Examining 31663 files, 762 dirs (in 1 specified)
0.037s user 0.060s system 99.88% cpu 0.097 total
0.040s user 0.053s system 67.59% cpu 0.138 total
0.027s user 0.067s system 97.13% cpu 0.096 total
0.020s user 0.073s system 96.78% cpu 0.096 total
0.027s user 0.067s system 96.71% cpu 0.096 total
$ X=0; while [ $X -lt 5 ]; do time dupd scan -q; X=$((X + 1)); done
0.090s user 0.077s system 79.69% cpu 0.209 total
0.100s user 0.070s system 82.49% cpu 0.206 total
0.107s user 0.067s system 60.84% cpu 0.285 total
0.090s user 0.080s system 80.92% cpu 0.210 total
0.097s user 0.077s system 81.33% cpu 0.213 total

I chose the most favorable run for the dupd results; the highest total time reported was 0.561 but similar inconsistency to data set 1 was also present here. Regardless, dupd is still over two times slower than jdupes on this data set.

My benchmarks of jdupes vs. dupd

I wanted to run thorough tests on both programs to compare both algorithmic and real-world performance. I also wanted to see how the use of SQLite affects dupd’s performance since that is a major difference and could be adding some overhead. I ran one set of tests with all scanned file data already in the block cache to test the algorithm’s raw speed (no disk access other than possibly dupd’s SQLite accesses) and another with drives synced and disk caches dropped prior to each run using “sync; echo 3 > /proc/sys/vm/drop_caches”. I tested dupd with and without the –nodb option to see if it made any difference. I turned off all forms of jdupes output except printing the final duplicate list. All program output for both programs was redirected to /dev/null to eliminate any waiting resulting from I/O blocking on terminals or disks. The dupd SQLite database was purged during all runs.

Cached (algorithmic) performance: data set 1

$ X=0; while [ $X -lt 5 ]; do time jdupes -Arq . >/dev/null; X=$((X + 1)); done
0.047s user 0.053s system 98.33% cpu 0.102 total
0.053s user 0.047s system 99.30% cpu 0.101 total
0.033s user 0.067s system 98.95% cpu 0.101 total
0.043s user 0.053s system 96.32% cpu 0.100 total
0.027s user 0.073s system 99.09% cpu 0.101 total
$ X=0; while [ $X -lt 5 ]; do rm -f ~/.dupd_sqlite; sync; time dupd scan -q >/dev/null 2>/dev/null; X=$((X + 1)); done
0.087s user 0.110s system 91.32% cpu 0.215 total
0.110s user 0.087s system 91.61% cpu 0.215 total
0.107s user 0.090s system 90.56% cpu 0.217 total
0.120s user 0.077s system 68.85% cpu 0.286 total
0.117s user 0.077s system 92.83% cpu 0.208 total
$ X=0; while [ $X -lt 5 ]; do rm -f ~/.dupd_sqlite; sync; time dupd scan -q --nodb >/dev/null 2>/dev/null; X=$((X + 1)); done
0.100s user 0.093s system 140.85% cpu 0.137 total
0.117s user 0.073s system 140.16% cpu 0.136 total
0.110s user 0.080s system 140.22% cpu 0.136 total
0.100s user 0.090s system 139.95% cpu 0.136 total
0.113s user 0.077s system 140.69% cpu 0.135 total

Wow! dupd’s performance went up significantly with the –nodb option! This seems to prove that SQLite is slowing things down for these one-shot runs. Even with the 30+% performance boost, the dupd algorithm still seems to be 35% slower than jdupes despite dupd having the obvious advantage of multi-threaded execution.

Cached (algorithmic) performance: data set 2

 $  X=0; while [ $X -lt 5 ]; do time jdupes -Arqm . >/dev/null; X=$((X + 1)); done
0.027s user 0.063s system 99.29% cpu 0.091 total
0.037s user 0.050s system 95.70% cpu 0.091 total
0.040s user 0.047s system 95.93% cpu 0.090 total
0.033s user 0.057s system 99.29% cpu 0.091 total
0.033s user 0.053s system 96.08% cpu 0.090 total
$ X=0; while [ $X -lt 5 ]; do rm ~/.dupd_sqlite; sync; time dupd scan -q >/dev/null 2>/dev/null; X=$((X + 1)); done
0.090s user 0.080s system 58.91% cpu 0.289 total
0.107s user 0.063s system 82.97% cpu 0.205 total
0.110s user 0.060s system 65.64% cpu 0.259 total
0.110s user 0.060s system 47.40% cpu 0.359 total
0.100s user 0.073s system 59.90% cpu 0.289 total
$ X=0; while [ $X -lt 5 ]; do rm -f ~/.dupd_sqlite; sync; time dupd scan -q --nodb >/dev/null 2>/dev/null; X=$((X + 1)); done
0.113s user 0.053s system 136.57% cpu 0.122 total
0.103s user 0.063s system 136.45% cpu 0.122 total
0.107s user 0.060s system 138.46% cpu 0.120 total
0.097s user 0.067s system 136.78% cpu 0.119 total
0.090s user 0.077s system 137.49% cpu 0.121 total

For some reason, this data set significantly slowed down the SQLite-enabled run of dupd. It’s now about three times slower than jdupes. A major speedup with –nodb appears again, keeping in line with the approximate 1/3 slower performance than jdupes seen in the previous test.

Real-world performance: data set 1

# X=0; while [ $X -lt 5 ]; do sync; echo 3 > /proc/sys/vm/drop_caches; time jdupes -Arq . >/dev/null; X=$((X + 1)); done
 0.210s user 0.790s system 1.52% cpu 65.432 total
 0.190s user 0.730s system 1.39% cpu 66.036 total
 0.137s user 0.780s system 1.39% cpu 65.574 total
 0.230s user 0.813s system 1.59% cpu 65.361 total
 0.167s user 0.800s system 1.47% cpu 65.444 total
 # X=0; while [ $X -lt 5 ]; do rm -f ~/.dupd_sqlite; sync; echo 3 > /proc/sys/vm/drop_caches; time dupd scan -q >/dev/null 2>/dev/null; X=$((X + 1)); done
0.293s user 0.890s system 1.74% cpu 67.809 total
0.273s user 0.960s system 1.81% cpu 67.766 total
0.243s user 0.873s system 1.64% cpu 68.069 total
0.247s user 0.910s system 1.70% cpu 67.965 total
0.267s user 0.827s system 1.61% cpu 67.830 total
# X=0; while [ $X -lt 5 ]; do rm -f ~/.dupd_sqlite; sync; echo 3 > /proc/sys/vm/drop_caches; time dupd scan -q --nodb >/dev/null 2>/dev/null; X=$((X + 1)); done
0.273s user 0.767s system 1.54% cpu 67.403 total
0.253s user 0.930s system 1.75% cpu 67.448 total
0.233s user 0.817s system 1.55% cpu 67.409 total
0.223s user 0.890s system 1.63% cpu 67.908 total
0.273s user 0.987s system 1.83% cpu 68.511 total

AHA! Now that we’re testing on real disks with a large uncached workload, the story is very different. Neither jdupes nor dupd will make your hard drives faster. While dupd is still slower, the extra two or three seconds pales in comparison to the disk I/O time, bringing the performance gap down to an insignificant ~3.7%. Note that –nodb didn’t make a significant difference this time either. No one will ever notice that 0.3-0.4 second speedup.

Real-world performance: data set 2

# X=0; while [ $X -lt 5 ]; do sync; echo 3 > /proc/sys/vm/drop_caches; time jdupes -Arq . >/dev/null; X=$((X + 1)); done
 0.140s user 0.610s system 1.40% cpu 53.333 total
 0.147s user 0.717s system 1.56% cpu 55.284 total
 0.160s user 0.683s system 1.52% cpu 55.268 total
 0.173s user 0.710s system 1.60% cpu 54.890 total
 0.157s user 0.697s system 1.55% cpu 54.968 total
X=0; while [ $X -lt 5 ]; do rm -f ~/.dupd_sqlite; sync; echo 3 > /proc/sys/vm/drop_caches; time dupd scan -q >/dev/null 2>/dev/null; X=$((X + 1)); done
0.227s user 0.730s system 1.69% cpu 56.389 total
0.220s user 0.817s system 1.82% cpu 56.755 total
0.250s user 0.760s system 1.77% cpu 56.785 total
0.230s user 0.773s system 1.79% cpu 56.044 total
0.223s user 0.750s system 1.73% cpu 56.241 total
# X=0; while [ $X -lt 5 ]; do rm -f ~/.dupd_sqlite; sync; echo 3 > /proc/sys/vm/drop_caches; time dupd scan -q --nodb >/dev/null 2>/dev/null; X=$((X + 1)); done
0.293s user 0.750s system 1.83% cpu 56.803 total
0.237s user 0.727s system 1.71% cpu 56.052 total
0.247s user 0.773s system 1.82% cpu 55.988 total
0.177s user 0.873s system 1.86% cpu 56.439 total
0.217s user 0.820s system 1.83% cpu 56.409 total

Data set 1 and data set 2 have the same results. When disk access overhead is included in testing, the algorithmic speed differences don’t seem to make a significant difference overall.

Real-world performance: data set 3 (bonus round)

Based on the tight match with lots of files generally around 0.5 MB in size, I decided to do some extra real-world tests. Data set 3 is all of my personal photography, scanned family photos, and video clips from a combination of my various Android phones and my Canon T1i DSLR. Statistics: over 18500 files in 395 directories, average size 2.6 MB, smallest 0, largest 552 MB, 47GB total, no duplicates or hard links at all.

# X=0; while [ $X -lt 5 ]; do sync; echo 3 > /proc/sys/vm/drop_caches; time jdupes -Arq . >/dev/null; X=$((X + 1)); done
0.030s user 0.243s system 2.02% cpu 13.483 total
0.043s user 0.247s system 2.14% cpu 13.542 total
0.040s user 0.230s system 2.03% cpu 13.245 total
0.030s user 0.230s system 1.95% cpu 13.265 total
0.040s user 0.223s system 1.97% cpu 13.308 total
# X=0; while [ $X -lt 5 ]; do rm -f ~/.dupd_sqlite; sync; echo 3 > /proc/sys/vm/drop_caches; time dupd scan -q >/dev/null 2>/dev/null; X=$((X + 1)); done
0.060s user 0.267s system 2.59% cpu 12.601 total
0.063s user 0.267s system 2.63% cpu 12.510 total
0.057s user 0.277s system 2.67% cpu 12.447 total
0.057s user 0.273s system 2.65% cpu 12.432 total
0.053s user 0.273s system 2.62% cpu 12.447 total
# X=0; while [ $X -lt 5 ]; do rm -f ~/.dupd_sqlite; sync; echo 3 > /proc/sys/vm/drop_caches; time dupd scan -q --nodb >/dev/null 2>/dev/null; X=$((X + 1)); done
0.080s user 0.257s system 2.67% cpu 12.566 total
0.080s user 0.253s system 2.68% cpu 12.428 total
0.053s user 0.253s system 2.47% cpu 12.371 total
0.053s user 0.250s system 2.43% cpu 12.445 total
0.093s user 0.240s system 2.68% cpu 12.432 total

The plot thickens. On this data set with no duplicates, no hard links, and a wide variety of file sizes, jdupes is slower than dupd by ~6.4%, a very different result than with the huge sets of smaller files. It’s still not a large real-world variance; no one will miss the 0.8 second delay, but it is a very interesting result because it contradicts every previous test that says dupd is the slower choice. I also find it interesting that the gap between dupd with and without –nodb closes up on this data set.

Real-world performance: data set 4 (bonus round)

This is a superset of data set 1. It’s the same kind of data but it’s an absolutely massive set with much more variance and no shortage of duplicates, both hard linked and still duplicated. Stats: over 900,000 files in 12599 directories, average size 527 KB, smallest file 37 bytes, largest file 55 MB, lots of hard links and duplicates. After an entire day at work and only finishing three runs of jdupes (not unusual for this data set) I decided that two days worth of not accessing the machine to accommodate testing was too inconvenient, so I ultimately only finished one dupd test.

# X=0; while [ $X -lt 5 ]; do sync; echo 3 > /proc/sys/vm/drop_caches; time jdupes -Arq . >/dev/null; X=$((X + 1)); done
18.750s user 87.107s system 1.35% cpu 7818.862 total
18.047s user 86.247s system 1.32% cpu 7894.973 total
18.400s user 87.173s system 1.33% cpu 7890.817 total
# X=0; while [ $X -lt 5 ]; do rm -f ~/.dupd_sqlite; sync; echo 3 > /proc/sys/vm/drop_caches; time dupd scan -q >/dev/null 2>/dev/null; X=$((X + 1)); done
25.380s user 104.373s system 1.32% cpu 9804.224 total
^C

Why was dupd 2000 seconds slower than jdupes? I can only speculate. One possibility is that the multi-thread behavior of the program results in extra disk thrashing. My understanding is that dupd uses one thread to read metadata and another thread to perform hash and compare work; if directory reads and file reads happen at the same time (they reach the I/O queue in succession) the disk will have to thrash between those two locations to fulfill the I/O requests. Perhaps the deadline I/O scheduler and dupd don’t work well together. Perhaps SQLite overhead plays a big role. I know that 900,000 files are probably scattered across the disk from one another, so it could be that the always-sequential jdupes file access characteristics plus the large I/O block size (jdupes processes files in 1 MiB chunks at a time) reduce disk thrashing for this data; indeed, with an average file size of well under 1 MiB, an entire file is almost always read in one sequential shot.

Thoughts and conclusions

As far as bragging rights go, jdupes has a superior raw algorithm but dupd can still beat it marginally in real-world tests. Duplicate scanning is rarely performed on files that are 100% cached in RAM, so a program’s disk access characteristics relative to the data set being scanned can be more important than being double the speed in unrealistic algorithm benchmarks. In real-world testing with no pre-cached disk blocks available to artificially soften the huge performance hit of disk thrashing, jdupes and dupd are close enough in performance that neither is a “winner.” They generally seem to do their jobs at about the same speed on most of the data I’ve tested against…so which one should you use? The answer is very simple: use whichever tool you’re comfortable with that does what you want to do. I am partial to jdupes for obvious reasons and I have explained what I don’t like about dupd usage and behavior, but I’m also aware of some glaring flaws in how jdupes works as well. It’s a lot like deciding between two different claw hammers to bang on a nail: you can argue about the minor differences in appearance, dimensions, and weight all day long, but most users just have the need to hit nails and don’t have any reason to care which hammer they use to get the job done.

I’ve traced the terrible dupd performance on my huge data set down to dupd reading 8 KiB of each file at a time versus jdupes reading 1024 KiB (1 MiB) at a time, a difference that almost certainly reduces I/O slowdowns from disk thrashing. I’ve submitted a few bug fixes and pull requests for dupd to help Jyri keep track of the issues I’ve experienced and to improve dupd, including a mention of the bad performance due to the read block size. I also learned some tricks from the dupd source code that I hadn’t thought of before; they may not be useful in jdupes development, but I feel enriched as a programmer from my experience with the program and its code and I’ve tried to contribute back in exchange. Everyone wins!

Isn’t that what open source software is all about?

Disable Windows Vista/7/8/8.1 Thumbnail Caches (Privacy, Performance, Paranoia, and Anti-Forensics)

By default, every version of Windows since XP creates thumbnail database files that store small versions of every picture in every folder you browse into with Windows Explorer. These files are used to speed up thumbnail views in folders, but they have some serious disadvantages:

  1. They are created automatically without ever asking you if you want to use them.
  2. Deleting an image file doesn’t necessary delete it from the thumbnail database. The only way to delete the thumbnail is to delete the database (and hope you deleted the correct one…and that it’s not stored in more than one database!)
  3. These files consume a relatively small amount of disk space.
  4. The XP-style (which is also Vista/7/8 style when browsing network shares) “Thumbs.db” and the Windows Media Center “ehthumbs_vista.db” files are marked as hidden, but if you make an archive (such as a ZIP file) or otherwise copy the folder into a container that doesn’t support hidden attributes, not only does the database increase the size of the container required, it also gets un-hidden!
  5. If you write software, it can interfere with software version control systems. They may also update the timestamp on the folder they’re in, causing some programs to think your data in the folder has changed when it really hasn’t.
  6. If you value your privacy (particularly if you handle any sort of sensitive information) these files leave information behind that can be used to compromise that privacy, especially when in the hands of anyone with even just a casual understanding of forensic analysis, be it the private investigator hired by your spouse or the authorities (police, FBI, NSA, CIA, take your pick).

To shut them off completely, you’ll need to change a few registry values that aren’t available through normal control panels (and unavailable in ANY control panels on any Windows version below a Pro, Enterprise, or Ultimate version). Fortunately, someone has already created the necessary .reg files to turn the local thumbnail caches on or off in one shot. The registry file data was posted by Brink to SevenForums. The files at that page will disable or enable this feature locally. These will also shut off (or turn on) Windows Vista and higher creating “Thumbs.db” files on all of your network drives and shares.

If you want to delete all of the “Thumbs.db” style files on a machine that has more than a couple of them, open a command prompt (Windows key + R, then type “cmd” and hit enter) and type the following commands (yes, the colon after the “a” is supposed to be followed by an empty space):

cd \

del /s /a: Thumbs.db

del /s /a: ehthumbs_vista.db

This will enter every directory on the system hard drive and delete all of the Thumbs.db files. You may see some errors while this runs, but such behavior is normal. If you have more drives that need to be cleaned, you can type the drive letter followed by a colon (such as “E:” if you have a drive with that letter assigned to it, for example) and hit enter, then repeat the above two commands to clean them.

The centralized thumbnail databases for Vista and up are harder to find. You can open the folder quickly by going to Start, copy-pasting this into the search box with CTRL+V, and hitting enter:

%LOCALAPPDATA%\Microsoft\Windows\Explorer

Close all other Explorer windows that you have open to unlock as many of the files as possible. Delete everything that you see with the word “thumb” at the beginning. Some files may not be deletable; if you really want to get rid of them, you can start a command prompt, start Task Manager, use it to kill all “explorer.exe” processes, then delete the files manually using the command prompt:

cd %LOCALAPPDATA%\Microsoft\Windows\Explorer

del thumb*

rd /s thumbcachetodelete

When you’re done, either type “explorer” in the command prompt, or in Task Manager go to File > New Task (Run)… and type “explorer”. This will restart your Explorer shell so you can continue using Windows normally.

AMD beats Intel on price versus performance every single time.

UPDATE: I wrote a newer “AMD beats Intel” article with much better information and more relevant processors.

This was written April 1, 2012 and is not an April Fool’s joke. If you’re reading this years later for some reason, check to see if my reasoning still applies.

I walked into a CompUSA store to purchase myself a new machine with lots of cores for faster compilation of the Tritech Service System, among other things I do daily that require Linux and for which I didn’t have a decent home machine to work with. Ever since I got Netflix, my Toshiba Satellite P775-S7215 (arguably the best laptop I’ve ever used in my life, and certainly more than I ever paid for a laptop before) has been stuck in Windows 7 so that I can watch things while I work. It’s also nice to have the Windows GUI running for Internet use and document reading while plunking around in Linux on the compiling machine, which I have given the name “Beast” because…well, it’s a beast…but I digress. I walked into a CompUSA store, started tossing items into the shopping cart, and got to the CPUs, for which someone must help me since they’re behind a counter.

I asked what they had, and then said I was debating AMD vs. Intel. The employee behind the counter made the blanket statement, “Intel is always going to beat AMD.” I knew better, so I headed over to my favorite place to compare raw CPU performance, and started asking him for CPU prices and names. When PRICE was taken into account, AMD always beat Intel, rather than what he had told me, and he seemed as if he had lost a piece of his religion when I told him about it. There’s a serious problem in the computer hobbyist world where blanket statements are made and repeated ad infinitum regarding a variety of things, and this AMD vs. Intel performance debate is the worst of them all.

Before I explain why I say Intel loses to AMD on every price-to-performance ratio comparison, I’d like to mention another hardware experience that came before this which illustrates that skepticism and Google-Fu are extremely powerful tools. The WD20EARS 2TB 5900RPM SATA hard drives no longer have the excessive head unloading issue, which was a severe problem and very common cause of failure before even a single year of use was had in those particular Western Digital drives (and I believe some other early WD Green drives as well). I know this because I looked it up while staring at two of these drives I wanted, and reading that the issue was no longer present in the newer series of WD20EARS drives, and then purchasing them and using smarton montools in Linux to CHECK THE HEAD UNLOAD COUNT during a variety of usage scenarios. The count didn’t exceed 100 unloads within a week, and that put the issue to rest for me. (The approximate unload count needed for a drive to start failing is 300,000 and 100 in a week would take 3,000 weeks to reach that unload count.) I got two 2TB hard drives for $80 before the Thailand flooding happened, and I don’t have to worry about a manufacturer-caused premature failure occurring in them.

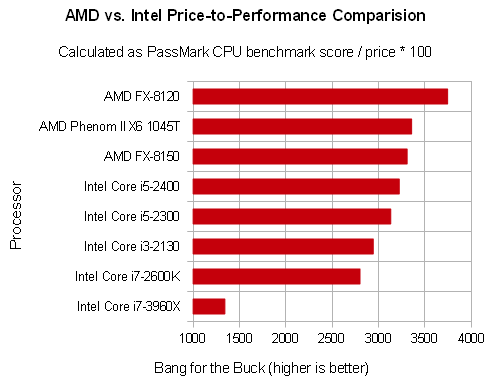
On to the meat of this discussion. My methodology is extremely simple. Go to a website such as Newegg, pull up CPUs that are the same price (or very nearly so), and compare the CPUs at cpubenchmark.net. If you’d like to give them some sort of price-to-performance score so you can perform comparisons across prices, you can divide the CPU benchmark score by the price, then multiply by 100 (since you’ll get LOTS of decimal places). Let’s see how this works out in real-world terms. As of April 1, 2012, the price of an AMD Phenom II X6 1045T processor at Newegg is $149.99, while the best Core i3 available at Newegg (the Core i3-2130 dual-core) is also $149.99. There are two other Core i3 CPUs at that price, but they are slower or are a first-generation i3, and anyone who is a savvy buyer will get the best bang for the buck, so those are being ignored. Why not an i5 or i7? Well, it’s not an apples-to-apples comparison when you put a Phenom II X6 against an i5 or i7, not because of some notion of “CPU generation,” but because you can’t even get a Core i5 desktop CPU at Newegg for less than $179.99, so there’s simply no i5 or better in the Phenom II X6 price range; also keep in mind that I’m justifying a personal purchase which fits personal budgetary concerns (mine was a 1035T for $130), and I put the price difference toward getting 16GB of RAM instead. If you have a higher budget, you’d need to compare against a better AMD CPU, which we’ll do in a minute. So if we perform the price-to-performance score calculation that I came up with earlier, what do we come up with for these CPUs? We’ll also compare the cheapest available i5, which on a price-to-performance scale is also beaten by the selected Phenom II X6.

AMD Phenom II X6 1045T Thuban 2.7GHz: 3355

Intel Core i3-2130 Sandy Bridge 3.4GHz: 2942

Intel Core i5-2300 Sandy Bridge 2.8GHz: 3130

So in terms of price-to-performance (which most of us refer to as “bang for the buck”) the AMD Phenom II X6 stomps both the i3 and i5 chips closest to its price. (Interestingly enough, we also see that the i5 is a much better value than the i3, both of which are the newer Sandy Bridge chips.) Let’s look at the new AMD FX chips that some of my friends have been raving about (and building gaming machines with) to see how they compare against the best possible Intel offering for the same price…

AMD FX-8120 Zambezi 3.1GHz ($189.99): 3743

Intel Core i5-2400 Sandy Bridge 3.1GHz ($189.99): 3222

The AMD FX chip pummels the Core i5 at the same price point, and even my Phenom II X6 fails to be “worth it” compared to the FX-8120. If I was not on a budget, I would have gone for the FX-8120 instead. Note how even though the i5-2400 is the best Intel chip in this comparison so far, it still scores 133 points lower than the Phenom II X6. Higher numbers mean more value for the price. Let’s do a few more comparisons against CPUs that I might be interested in if I was building a high-performance box with a higher budget, such as the awesome i7-2600K, just to see where the numbers fall.

Intel Core i7-2600K Sandy Bridge 3.4GHz ($324.99): 2799

Intel Core i7-3960X Extreme Edition Sandy Bridge-E 3.3GHz ($1049.99): 1342

AMD FX-8150 Zambezi 3.6GHz ($249.99): 3307

I’ve gathered all of these numbers into a chart to summarize the point of this article. I think the chart speaks for itself. I also invite you to do your own math and draw your own conclusions. Feel free to leave a comment as well!

Tuning a T-Mobile G1 with Cyanogenmod 6 (CM6) for optimal performance (no swap, compcache, or 10MB hack needed!)

IF THIS GUIDE HELPS YOU, PLEASE COMMENT. Last updated 2012-01-24.

[UPDATE: Added Android keyboard bug note; added step to remove ADWLauncher.]

[UPDATE 2: The launcher “Zeam” seems to be even lighter than LauncherPro.  Changing VM heap size to 12 and enabling JIT seems to improve the phone’s AVERAGE behavior considerably. While slower than after the initial boot with VM heap size = 24 + no JIT, the latter combination seems to slowly degrade performance until a reboot is needed, while the new settings don’t have such an effect. However, my phone is literally FULL with apps, so if you run lighter (i.e. remove Maps and Google Voice, don’t have many apps) you may prefer the 24MB heap size.]

[UPDATE 3: You REALLY should perform the EzTerry 14MB RAM hack which makes a massive difference, but requires more advanced work and is beyond the scope of this tutorial.]

I managed to FINALLY get my T-Mobile G1 to perform very well while running Cyanogenmod 6 (specifically I’m running CM 6.1-RC1 for Dream/Sapphire), and because it’s been such a difficult and elusive process, and people all over the Cyanogen forums have been screaming about often lackluster T-Mobile G1 performance (due to the 96MB of OS-usable RAM installed in the G1) I should share everything I’ve done to get this far.

What’s so different about my performance as compared to others who report GOOD performance with a CM6 G1 is that mine had started to become quite poor, which is often the case with these phones and custom ROMs.  Everything would work great after a wipe+flash, which erases pretty much everything, and then over the course of a few weeks the performance would drop until it became laggy and very annoying.  Reports of dialer/phone appearance on an incoming call lagging so severely that calls would be missed are not uncommon.

How does it perform?  Well, most of the time the launcher doesn’t unload, meaning my icons appear immediately when I go “home.”  When it does unload, it’s very quick to come up.  Application load times are drastically better and there is no noticeable lag in most usage cases.  In particular, the 3D gallery, which is very notorious for being slow to come up when using the default CM6 settings, pops up in approximately 5-6 seconds, and all of my 150 or so pictures on my 4GB Class 4 microSD card pop up in another 4-5 seconds (the first gallery startup makes thumbnails and is significantly slower, but we can ignore that since it’s largely a one-shot deal.)

BIG FAT UGLY NOTE TO ALL G1 CYANOGENMOD USERS: The default CM6 Dream/Sapphire settings are NOT OPTIMAL FOR THE T-MOBILE G1!!! I will be telling you to change settings in the “Performance settings” which has a BIG WARNING when you open it about dragons and voided warranties. Don’t worry, you’ll be safe with my setting changes.

First and foremost, you need to get some apps from the Market.  Search for and install the following:

  • Zeam (smaller) or LauncherPro (nicer) to replace ADW.Launcher
  • Home Switcher for Froyo
  • ConnectBot (not strictly needed as you can use Terminal Emulator, but ConnectBot makes things easier)

Now we’re ready to clean up the software on the G1 and get it performing like it was meant to.  Follow these steps:

  1. Run Home Switcher and set the default home app to LauncherPro or Zeam.
  2. Hit Home to get into LauncherPro, then hit Menu > Preferences > Advanced Settings > Memory Usage Settings > Memory Usage Preset, and select Light.
  3. Home > Menu > Settings > CyanogenMod Settings > Performance Settings > OK > Compcache RAM usage > Disabled
  4. Uncheck the following:  Use JIT, Enable surface dithering, Lock home in memory.
  5. Check Lock messaging app in memory.
  6. VM heap size > 24m
  7. You have a G1, so you probably don’t need the on-screen keyboard, and it takes up at least 5MB of RAM even if you aren’t using it.  Decide whether you want to have the on-screen keyboard or if you want to be stuck with only the 5-row slide-out keyboard. For me, the choice was obvious because the on-screen keyboard really, really sucks, so I turned it off. If you can do without the on-screen keyboard (and I highly recommend this step) then deactivate it: Home > Menu > Settings > Language & Keyboard > uncheck Android Keyboard.  [UPDATE: Looks like this box checks itself automatically when you reboot. Just uncheck it whenever you reboot; it’s probably a very minor bug in CM.]
  8. WARNING: the safe parts are now done and over with; in the next steps we will be stripping out Android apps that come with the CM6 system which can be sort of dangerous. Also, reflashing or upgrading CM will put these right back in place and you’ll need to repeat these steps.  (Apps exist to do these things more safely but I didn’t use them myself.)  If you are not comfortable with removing unnecessary system apps, stop here.  This page is very helpful reference for this: http://wiki.cyanogenmod.com/index.php?title=Barebones
  9. We need to remove Voice Search, Amazon MP3 (if applicable), Google Quick Search Box, and News and Weather. These apps seem to run themselves or a system service component all the time, and that means using memory unnecessarily.  (Plus, no one seems to use them anyway.)
  10. Run ConnectBot. Go through their tutorial if you like. Pay attention to how right-alt types a forward slash and right-shift performs “tab completion” of file names for you (in bash). These are very handy for typing the often long app file names. When you can open a new connection, change the connection type from “ssh” to “local” and hit [enter] in the empty box to the right of it.
  11. At the $ prompt, type su and hit enter. This will prompt for superuser access; allow the action to proceed. You’ll be changed to a # prompt.  Type bash and hit enter.  This will give you more junk before the # but otherwise it’s the same.  (Using bash gives us the handy tab completion, remember?)  Type the remaining steps in exactly as they are written, one per line.  If Amazon MP3 is not installed (on some versions) then the Amazon lines may return errors.  Note that after running any of the “pm uninstall” commands you will need to push the trackball button and then the letter “c” after you get “Success” to continue. For some reason it never seems to return to the command prompt if you don’t do this, but whatever.  Remember, you can hit right-shift to have the system complete the file names once you type enough characters.
  12. mount -o remount,rw /system
  13. rm -f /system/app/com.amazon.mp3.apk
  14. rm -f /system/app/GoogleQuickSearchBox.apk
  15. rm -f /system/app/GenieWidget.apk
  16. rm -f /system/app/VoiceSearch.apk
  17. pm uninstall com.amazon.mp3
  18. pm uninstall com.google.android.googlequicksearchbox
  19. pm uninstall com.google.android.apps.genie.geniewidget
  20. pm uninstall com.google.android.voicesearch
  21. [UPDATE] ADWLauncher apparently will continue to eat memory in the background even though you switched to LauncherPro.  Use the following command to make ADW go away (note you can reverse the process if you have to, or update/reflash):
  22. mv /system/app/ADWLauncher.apk /data/

[UPDATE: Don’t remove ADWLauncher; if something goes wrong and you remove Zeam or LauncherPro, you’ll have NO LAUNCHER and a reflash will be forced upon you. The 14MB hack will relieve some of the memory pressure and make this unnecessary anyway.]

Type “exit” three times to leave the console.  After all of this mess is completed, I’d suggest rebooting the phone to make sure everything is in a consistent state.  I noticed that lots of services run at initial startup, so don’t be alarmed if the G1 is slow for about a minute after the launcher appears.  I have found that deleting my Messaging threads and limiting them to 100 messages per contact significantly boosts Messaging app performance. Since Messaging is locked in memory, you might want to regularly clean it out to maintain optimal performance.  The same goes for the various Browser caches and saved information, though cleaning these will only make Browser perform better and has no effect on the entire phone.

After doing all of this, I noticed that my phone boots faster and is extremely responsive all of the time.  Even when the system reloads LauncherPro or starts an app from scratch, it’s MUCH faster to do so.  AGAIN, note that I am NOT using ANY of the following performance hacks:

  • Compcache (not even 10%, it’s DISABLED)
  • The Dalvik JIT compiler
  • Swap file on the SD card
  • 10MB RAM hack
  • Task/process killer applications (they’re unnecessary anyway)

Please leave a comment with feedback if you followed these directions.  I can’t provide help (that’s what the CM forums are for), I just want to know how it works for others.  Thanks!